
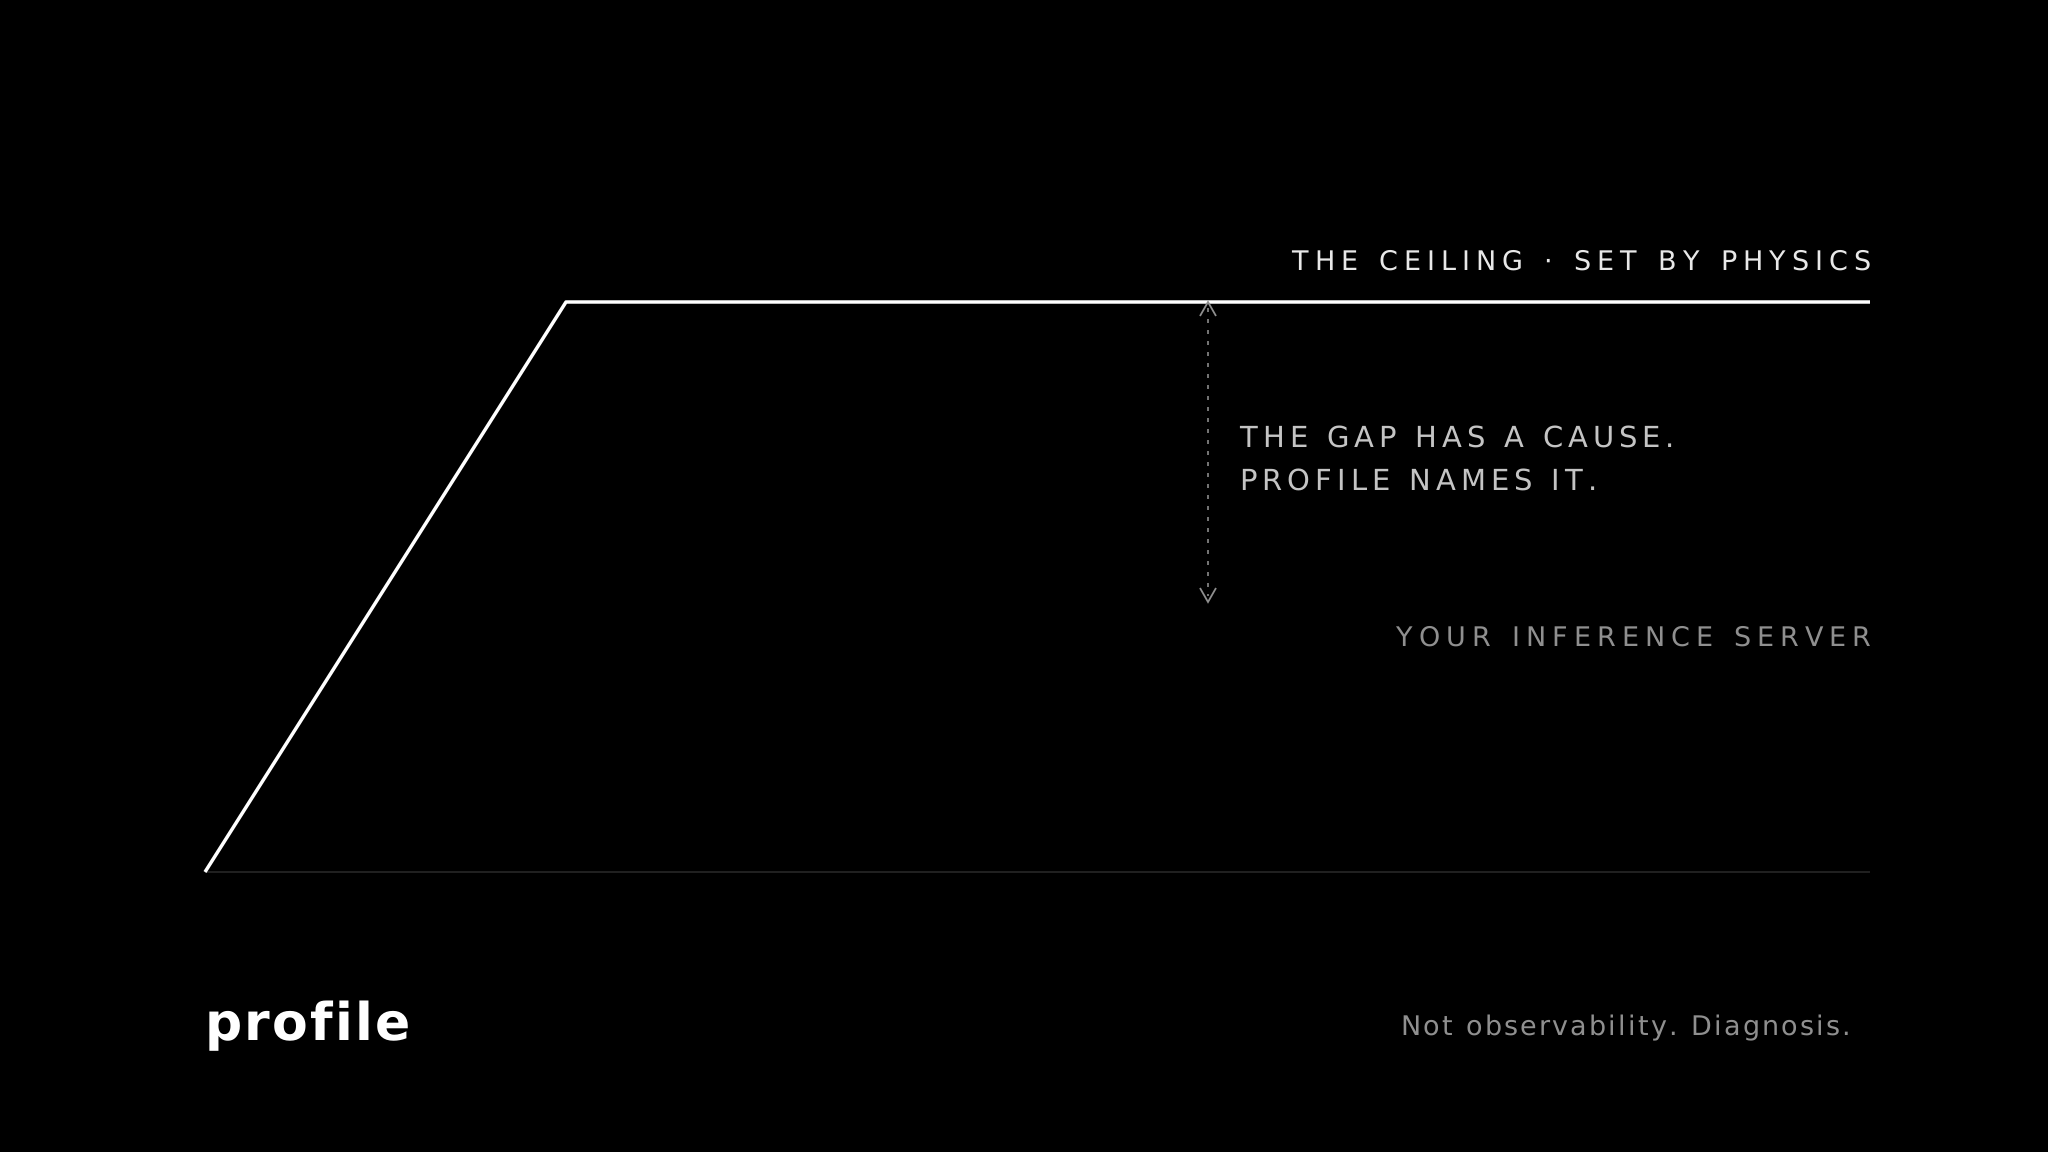
Profile computes the physics ceiling for your GPU and model, measures the live server against it, names the one cause holding it back, and gives you the flag to change. Then it measures whether the fix worked. Close the gap in a few measured iterations instead of guessing for days.
Every value is measured or marked. A dash means Profile could not read it. An (est) means the number came from the physics model, not the server.
PROFILE v2.2.1 [muse-glimmer-30b] [NVIDIA GeForce RTX 5090]

GPU        decode_eff ~3.5% | power 531W | $2.10/1M output tok (est) | vRAM 29/32GB
REQUESTS   run 9 (27.4%) | wait 15 | max 32
LATENCY    ttft 32.8s (p95 66.9s) | tpot 58ms (p95 89ms)
CACHE      kv_cache 88.6% avg (99.9% peak) | pfix_cache 22.7%
THROUGHPUT 131 tok/s

ISSUES:

[!] KV Cache Pressure   seen in 100% of windows
    Cause:  KV cache 89% avg in fired windows, 100% peak (threshold: 88%)
            Scheduler evicting; 15 requests queued on KV admission
    Fix:    Raise --gpu-memory-utilization. Switch --kv-cache-dtype fp8.
            Lower --max-model-len 32768 → 21933. Observed p99 21.9k tok/request.
    Confidence: High
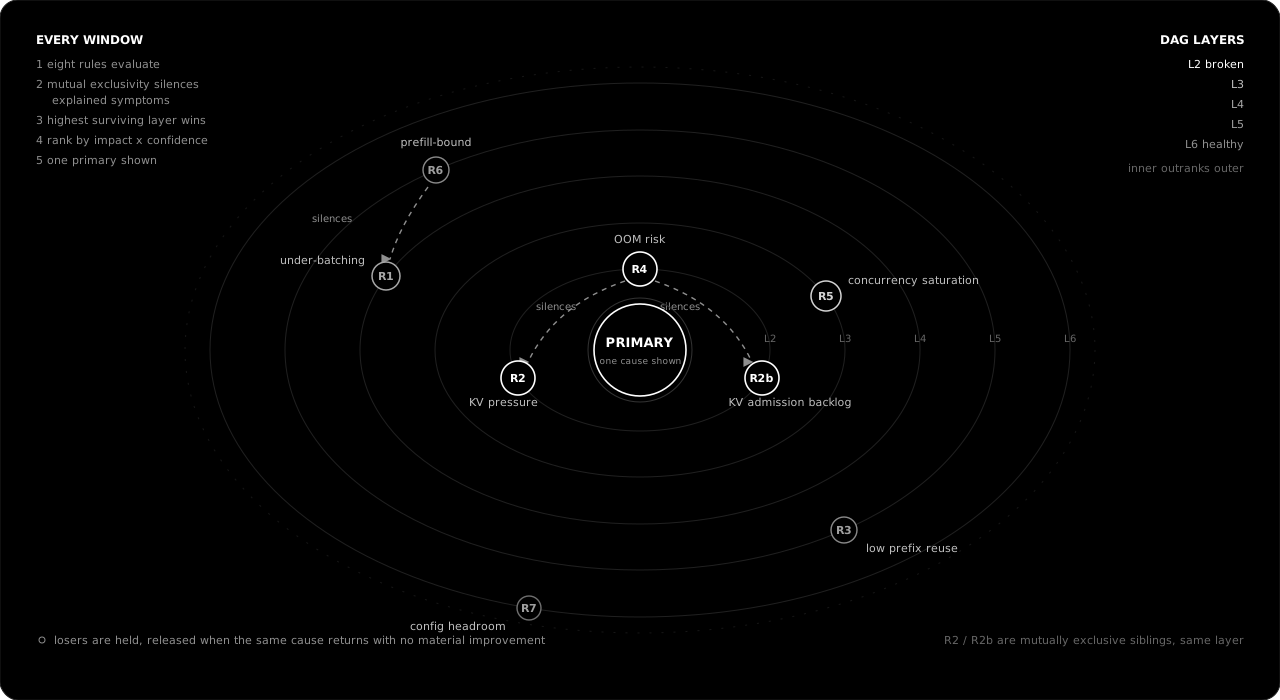
Eight rules watch eight failure modes. A mutual exclusivity table removes symptoms another cause already explains (Prefill silences Under-batching only when the box is pressed; soft field keeps Under-batching first), and a priority DAG keeps a tuning suggestion from ever outranking an active bottleneck. One primary is shown; the rest are held.
Profile reads the live server under its own traffic. No restarts, no synthetic load, no agent.
Everything in the block, one restart. Profile reconnects when vLLM returns.
New --max-num-seqs [current: 32]: 12
Regressions are labelled, not buried. A tool that only reports improvements cannot be trusted when it reports one.
Throughput   183 → 131 tok/s  worse
TTFT         430 → 32797ms  worse
TPOT         28.1 → 58.5ms  worse

ECONOMICS:
Cost/1M      $1.50 → $2.10 (est)  worse
| Throughput | 81 → 421 tok/s |
| Cost | $3.41 → $0.65 / 1M tok |
| Throughput | 257 → 490 tok/s |
| Cost | $3.23 → $1.69 / 1M output tok |
| TTFT | 1.9s → 539ms |
The 5090 path was 81, 183, 131, 421 tok/s. Raising agents without a KV fix dropped throughput and sent TTFT to 33s; Profile labelled it worse, then the flags recovered it. The H100 path was 257, 278, 490 tok/s, with a 172s flood step labelled the same way. Your starting point sets your gain; a server already near its ceiling has nothing to recover, and Profile says so.
Today, Profile diagnoses a single node, and every number it prints is measured or marked as an estimate. That constraint is the product: a diagnostic tool has nothing but its credibility.
The end state is a control plane. Profile running as a daemon across a fleet: re-sharding a node paying the PCIe tensor-parallel tax, moving traffic off a node under KV pressure before latency spikes, holding every node at the SLA-throughput knee as traffic shifts through the day.
None of that is safe to build until the physics and the engine are right on one node. That is the work happening now, in the open.
vLLM on one GPU, /metrics reachable, live traffic. Then install, diagnose, apply the Fix, read the delta. Repeat until the loop names a wall or goes quiet. Profile never restarts your server.
curl --proto '=https' --tlsv1.2 -LsSf \
  https://github.com/jungledesh/profile/releases/latest/download/profile-installer.sh | sh
profile diagnose --url http://localhost:8000/metrics --duration 30s
Default window is 30s. Raise --duration when traffic repeats inside the window (up to 30m). Idle server: drive load with vllm bench serve. No curl-pipe: binary from the releases page, or cargo install --git https://github.com/jungledesh/profile. NVIDIA or AMD, one GPU. Nothing leaves the machine. Full flag and output guide: docs.