GPU specs, model parameters, and cloud prices resolved once at startup.
GPUs
FP32 TFLOPs and memory bandwidth feed the roofline math. Prices are market-average estimates as of 2026-06. Use --cost-per-hour for exact rates.
GPU
Arch
FP32 TFLOPs
Mem BW GB/s
On-demand $/hr
Spot $/hr
H100 PCIe
Hopper
60.0
2,000
$2.20
$0.90
H100 SXM
Hopper
67.0
3,350
$3.45
$1.85
H200
Hopper
67.0
4,800
$3.50
$2.00
A100 80GB
Ampere
19.5
2,039
$1.50
$0.60
A100 40GB
Ampere
19.5
1,555
$1.50
$0.60
A10G
Ampere
—
—
$1.00
$0.40
L40S
Ada
91.6
864
$1.80
$0.80
RTX 4090
Ada
82.6
1,008
—
—
RTX Pro 6000 Blackwell
Blackwell
125.0
960
—
—
B200
Blackwell
20.0
8,000
$6.00
$3.50
GB200
Blackwell
—
—
$8.50
$4.00
GB10 (DGX Spark)
Blackwell
20.0
273
—
—
FP32 TFLOPs are non-tensor-core throughput; the conservative roofline input. All values labeled (est) in output. A10G and GB200 have price entries only; roofline is skipped for those GPUs. A plain "A100" without a size token (80GB or 40GB) in the NVML name will not match; Profile requires the size to disambiguate. Prices sampled across AWS, GCP, Azure, Lambda, Nebius, RunPod, CoreWeave, and GMI Cloud.
Models
Matched by token against the model name vLLM reports at startup.
Model
Total params
Active params
MoE
Llama 4 Maverick
400B
17B
Yes
Llama 4 Scout
109B
17B
Yes
Llama 3 405B
405B
—
No
Llama 3 70B
70B
—
No
Llama 3 8B
8B
—
No
Nemotron 70B
70B
—
No
Nemotron 8B
8B
—
No
Qwen3 235B
235B
22B
Yes
Qwen3 72B
72B
—
No
Qwen3 32B
32B
—
No
Qwen3 30B
30B
3B
Yes
Qwen3 14B
14B
—
No
Qwen3 7B
7B
—
No
Qwen2.5 72B
72B
—
No
Qwen2.5 32B
32B
—
No
Qwen2.5 14B
14B
—
No
Qwen2.5 7B
7B
—
No
DeepSeek 671B / R1 / V3
671B
37B
Yes
DeepSeek 70B
70B
—
No
DeepSeek 7B
7B
—
No
Mistral Large 675B
675B
52B
Yes
Mistral Large 123B
123B
—
No
Mixtral 8x22B
141B
39B
Yes
Mixtral 8x7B
47B
13B
Yes
Mistral 7B
7B
—
No
Gemma 27B
27B
—
No
Gemma 9B
9B
—
No
Kimi K2
1,000B
32B
Yes
GLM 744B
744B
56B
Yes
GLM 32B
32B
—
No
Phi 4 32B
32B
—
No
Phi 4 14B
14B
—
No
MoE models: active_param_count drives roofline ceilings; param_count (total) drives weight_gb and OOM headroom. Unrecognized models skip roofline entirely. To add a model or GPU, open an issue or submit a PR to the catalog files in src/context/.
Math
The formulas Profile runs on collected data.
Profile measures behavior under load. Idle time has no waste to cut. Ceilings are catalog-derived upper bounds, labeled (est). Missing data stays absent (None), never guessed.
Roofline: hardware ceilings
Baseline inputs
Input
Resolution
roofline_params
active_param_count if present, else param_count. Decode and prefill ceilings, efficiency %, ridge batch size.
weight_params
param_count if present, else active_param_count. weight_gb and kv_headroom_gb (OOM check).
bytes_per_param
DTYPE / VLLM_DTYPE env → kv_cache_dtype → catalog default → bf16 (2 bytes). fp8 = 1, fp16/bf16 = 2, fp32 = 4. Source labeled in output when fallback is used.
tensor_parallel_size
--tensor-parallel-size CLI flag → TENSOR_PARALLEL_SIZE / VLLM_TENSOR_PARALLEL_SIZE env var → 1. Scales both ceilings and per-GPU KV headroom.
Concurrent batch at which decode crosses from BW-bound to compute-bound. Below: BW limits throughput. At or above: compute limits throughput. Prefill floor display suppressed when num_running ≥ ridge_batch_size.
peak_bw_gbps, peak_flops, and params come from catalogs, not live measurement. All ceiling outputs labeled (est).
decode_ceiling_tps is TP-scaled (peak_bw × tp from the roofline above). Requires num_requests_running > 0 and generation_tokens_per_sec > 0. Not shown if actual_tps > aggregate_ceiling: that indicates a catalog or measurement mismatch.
Calibrated for decode-bound workloads. Prefill-heavy workloads (long prompts, short outputs) show artificially low efficiency %. The prefill ceiling is the relevant constraint there, not decode.
kv_headroom_gb: per-GPU; each GPU holds weight_gb/N with TP=N. Negative means current TP is insufficient. headroom_pct: unused fraction of the decode ceiling. tpot_floor_ms and prefill_floor_ms: theoretical minimum latencies at ceiling; actual values above these indicate overhead.
Economics
Metric
Formula
tok / W
generation_tokens_per_sec / power_watts
J / token
power_watts / generation_tokens_per_sec
$ / 1M tokens
(cost_per_hr / tokens_per_hr) × 1e6
Recoverable $/hr
cost_per_hr × (1 − efficiency_pct / 100)
tokens_per_hr = generation_tokens_per_sec × 3600. You pay cost_per_hr for that many tokens; scale to 1M.
Cost priority: --cost-per-hour flag, then GPU catalog on-demand price, then absent. Catalog-derived $/1M tok is labeled (est) in output; user-provided rates are not.
Computed after every re-measure cycle. Direction uses efficiency_delta_pp, not raw throughput. Dividing by num_running (time-weighted mean across the window) cancels traffic-induced concurrency changes; what remains is per-request hardware utilization.
Signal
Better
Worse
Plateau
efficiency_delta_pp (primary)
> +2.0 pp, and ttft_p99 not regressed > 20%
< −5.0 pp
between, or latency veto fired
throughput_delta_pct (fallback when efficiency unavailable)
> +10%
< −10%
between or both absent
Latency veto: if efficiency says Better but ttft_p99_delta_pct > +20%, direction is Plateau. Downgrades Better only; does not affect Plateau or Worse. Skipped on the throughput fallback path.
On Worse: loop pauses. Operator chooses [r] revert or [c] continue. On continue, the degraded state becomes the new baseline before the next iteration. On revert, baseline is unchanged.
All thresholds are provisional constants. Latency, cost, and p99 before/after are tracked alongside direction for display.
Per-window collection (~2s)
Each window polls at ~250ms intervals. GPU (NVML) and vLLM are collected in parallel threads on each poll. These formulas produce one snapshot before multi-window aggregation.
Metric type
Formula
On failure
Histogram mean (TTFT, TPOT, prefill, queue, prompt tokens)
Δsum / Δcount first→last scrape; ×1000 for seconds-based latencies
Last-scrape cumulative mean when Δcount ≤ 0
Histogram p99
Delta buckets, then linear interpolation at q=0.99
None. No cumulative fallback (stale p99 is worse than none)
Counter rate (tok/s, req/s, preemptions/s)
(last − first) / window_duration_secs
None on negative delta or zero duration. Zero delta is valid idle, not missing
Prefix cache hit rate
Δhits / Δqueries
None when Δqueries ≤ 0
GPU util, power
Mean across window polls
Poll skipped if NVML field absent
VRAM, temp (current)
Last poll
Peaks (vram_peak_mb, temperature_peak_c, kv_cache_peak_perc): max across polls/scrapes
Each ~2s window produces one snapshot. Fields aggregate by type across windows. Active: server under real load (requests running, KV or GPU util above threshold). Evaluable: endpoint responded with valid data.
Histogram means (TTFT, TPOT, prefill, queue latency)
Active
ΣΔsum / ΣΔcount across active windows. Weighted by observation count, not time.
p99 (TTFT, TPOT)
Active
Merge per-window delta bucket vectors (sum counts at matching boundaries), recompute q=0.99 via linear interpolation. Never average scalar p99 values.
KV cache avg, prefix cache hit rate, prompt_tokens_mean
Evaluable
KV avg: time-weighted mean. Prefix hit rate: Σ Δhits / Σ Δqueries across all evaluable windows.
KV / VRAM / temp peaks
Evaluable
max(per-window peak, last evaluable landing value) so aggregate peak ≥ displayed current.
State gauges (VRAM used, temp, sm_clock)
Evaluable (last)
Last evaluable window's landing value.
Cumulative counters (total tokens, total reqs)
All (chronological last)
Chronologically last collected window. Idle tail included. Preserves true Prometheus server totals.
All windows non-evaluable
—
Chronologically last raw window returned in full.
Rules
Five rules. Each fires when a specific bottleneck is confirmed under load.
Rules evaluate on structurally valid windows (window_is_evaluable). Recommendations surface only when a signal is persistent across evaluable windows.
R1: Under-batching
Condition
Threshold
Scheduler occupancy
<25% of max_num_seqs
No backlog
waiting < 2
Prefill not saturated
Δprefill_sum / window_secs < 0.40 AND Δprefill_sum < 4.0s
Prefill saturation uses histogram window mass (Δsum / window_secs), not the roofline ceiling. A window with more than 40% of its duration spent in prefill, or more than 4 absolute seconds, is not under-batched.
When the prefill gate suppresses R1, verbose mode (-v) shows why: Under-batching: not triggered (prefill saturated at 55%). Without -v, the rule appears as not triggered with no reason.
Fix: Raise client concurrency.
R2: KV cache pressure
R2 has two sub-variants. Both surface under the same [!] KV Cache Pressure header. The main path suppresses the backlog path when both fire.
Main path
Condition
Threshold
KV cache usage
≥88% (or preemptions active)
VRAM ≥78% is shown in output as corroborating evidence when present, but is not a required condition. R2 fires on KV usage or preemptions alone.
Fix: Reduce --max-num-seqs or --max-model-len.
Admission backlog path
Condition
Threshold
Queue ratio
waiting / (running + waiting) ≥ 30%
Free KV tokens
< demand from queued requests (waiting × prompt_tokens_mean)
Concurrency cap
running < max_num_seqs (scheduler not at cap)
Fires when the scheduler is holding requests in queue to protect KV memory, before KV usage crosses the 88% threshold. The fix is to expand the KV pool, not reduce concurrency.
Fix: Raise --gpu-memory-utilization if VRAM headroom exists; switch to fp8 KV cache; or reduce --max-model-len.
R2 evaluates against kv_cache_peak_perc, the maximum KV usage across all polls in the window, not the average. A window that averaged 70% but peaked at 92% will still fire. The spike is what causes preemptions. The average hides it.
R2 is the only rule that cross-references a live GPU reading (VRAM from NVML) with a live vLLM reading (KV cache usage). If gpu_observed_at and vllm_observed_at are more than 1 second apart, R2 is skipped. The other rules draw from a single source and don't have this constraint.
R3: Low prefix reuse
Condition
Threshold
Prefix cache hit rate
<35%
Mean prompt tokens
≥20
Request rate
≥5 req/s
Running requests
>0.75
Fix: If prefix caching is disabled: enable --enable-prefix-caching, then restructure prompts. If already enabled: move shared instructions to the start, standardize templates, avoid unique tokens at the beginning.
R4: OOM risk
Fires regardless of traffic. Configuration fact, not runtime observation.
Fix: Raise --max-num-seqs if KV peak <80%. If KV is at or above 80%, raising the cap will cause thrashing; add a replica or lower --max-model-len instead.
A rule that fired once is noise. Profile only surfaces a recommendation when the signal is persistent: at least 3 windows and at least 25% of all evaluable windows in the run.
R2 main path exception. Critical KV conditions bypass the standard gate early:
Condition
Windows required
Any window with active preemptions
1 (significant immediately)
KV ≥ 95% in ≥ 2 windows
2
Standard gate (KV 88–95%, no preemptions)
≥ 3 AND ≥ 25%
The admission backlog path and all other rules use only the standard gate.
Rules sorted by score, highest first. Grouped by root cause into IssueGroup. One primary recommendation surfaced per group: the rest are supporting evidence, not separate alerts.
Data
What, when, and how we collect.
Cadence
GPU and vLLM scraped in parallel, 250ms apart. One window is ~2 seconds, ~9 polls. Each collector timestamps on completion. If the two timestamps diverge by more than 1 second, rules that cross-reference both sources are skipped.
Within each window, different metric types are treated differently:
Type
Treatment
Edge cases
Gauges
Last scrape in the window
kv_cache_peak_perc is max across all scrapes in the window, not last. KV cache can spike and recover within a window; last scrape alone misses it. Shown in output when peak > avg + 10pp or peak ≥ 95%. Same pattern for VRAM peak (≥90% of total) and GPU temp peak (≥80°C).
Histograms
Δsum/Δcount, first to last scrape
Falls back to last-scrape cumulative mean when Δcount ≤ 0 (no new completions in window). p99 has no fallback; stale p99 is worse than none.
Counters
Rates = Δ / window duration. Raw totals from last scrape.
None on counter reset (negative delta) or zero-duration window. Zero delta is valid: no activity, not missing data.
Evaluable window gate
Two-tier gate. Structural validity and active traffic are separate checks.
Tier 1: structural. Did the endpoint respond and does the window have a valid duration? All rules use this check.
window_duration_secs  is present and positive
num_requests_running  is Some (even if zero)
running = 0 is valid data: the server responded and reported no active requests. None means the endpoint did not respond.
Tier 2: active. Was the server doing real work? Aggregated means use this check. Throughput, efficiency %, GPU utilization, and latency averages are computed over active windows only.
running_reqs > 0
AND (kv_cache_pct > 30%  OR  gpu_util_pct > 20%)

// both absent: running_reqs > 0 alone
// one absent:  evaluate the other arm only
kv_cache_pct catches decode and sustained load. gpu_util_pct catches prefill bursts where the KV cache is still near-empty. Idle windows pass tier 1 but not tier 2 and are excluded from the averages.
Multi-window aggregation, which window set applies to which field, is in Math.
Source 1: NVML
NVIDIA Management Library. Direct access to GPU hardware state, polled at 250ms intervals.
Field
Type
What it is
How collected
gpu_util_pct
Gauge
Fraction of time any kernel was executing. Not SM occupancy.
Mean across window polls
mem_util_pct
Gauge
Fraction of time the memory controller was busy
Mean across window polls
power_watts
Gauge
Power draw (W)
Mean across window polls
power_limit_watts
Gauge
Driver-set TDP limit (W)
Once at startup
vram_used_mb
Gauge
VRAM in use (MiB)
Last poll
vram_total_mb
Gauge
Total device VRAM (MiB)
Last poll
temperature_c
Gauge
GPU core temp (°C)
Last poll
sm_clock_mhz
Gauge
SM clock frequency (MHz)
Last poll
Two values are computed from the polls, not read directly from NVML: vram_peak_mb (max of vram_used_mb across all polls) and temperature_peak_c (max of temperature_c across all polls). Derived within the window, not collected.
NVML does not expose theoretical peak FLOPs or memory bandwidth. Those come from the GPU catalog, looked up once at startup from gpu_name, labeled (est) in output.
Source 2: vLLM Prometheus
Scraped from /metrics at ~250ms intervals, ~9 times per window. See vLLM docs for the full metric reference.
Rules grouped by root cause. One primary signal per group. Five simultaneous recommendations produce paralysis, not action.
Delta, not snapshot
Each iteration reports what changed since the last: direction, magnitude, likely cause. A snapshot without temporal comparison is a status report, not a diagnosis.
Shared traffic gate
window_is_evaluable is one function, called once, used by all rules. Idle state has no waste to measure.
Engine never imports CLI
The reasoning layer is deterministic and testable in isolation. Adding a new interface (SGLang, API) doesn't touch the engine.
250ms collection interval
Fast enough to catch GPU utilization transients that a 1s or 5s poll would average away. Slow enough that scrapes per window add no meaningful load to the vLLM endpoint or NVML.
Peak over average for KV cache
KV cache usage is tracked as the maximum across all scrapes in a window, not the last value. A spike that causes preemptions and latency degradation can recover before the window ends. The last scrape reports a safe number while the damage already happened. The peak is the signal. The average buries it.
Zero allocation in the hot loop
AnalysisInput<'a> borrows both contexts. No clones per 250ms window. A profiler that eats its target's resources is worse than no profiler.
Security
rustls only, no OpenSSL. Read-only NVML. No external API calls. No telemetry. cargo audit clean before every release tag.
The Inference Problem
Apr 19, 2026
TL;DR
Inference is 80–90% of your AI system's lifetime cost, not training.
Production servers bleed compute across batching gaps, KV cache pressure, prefill overhead, low throughput, and high latency.
The problems are fixable. Most teams can't see them.
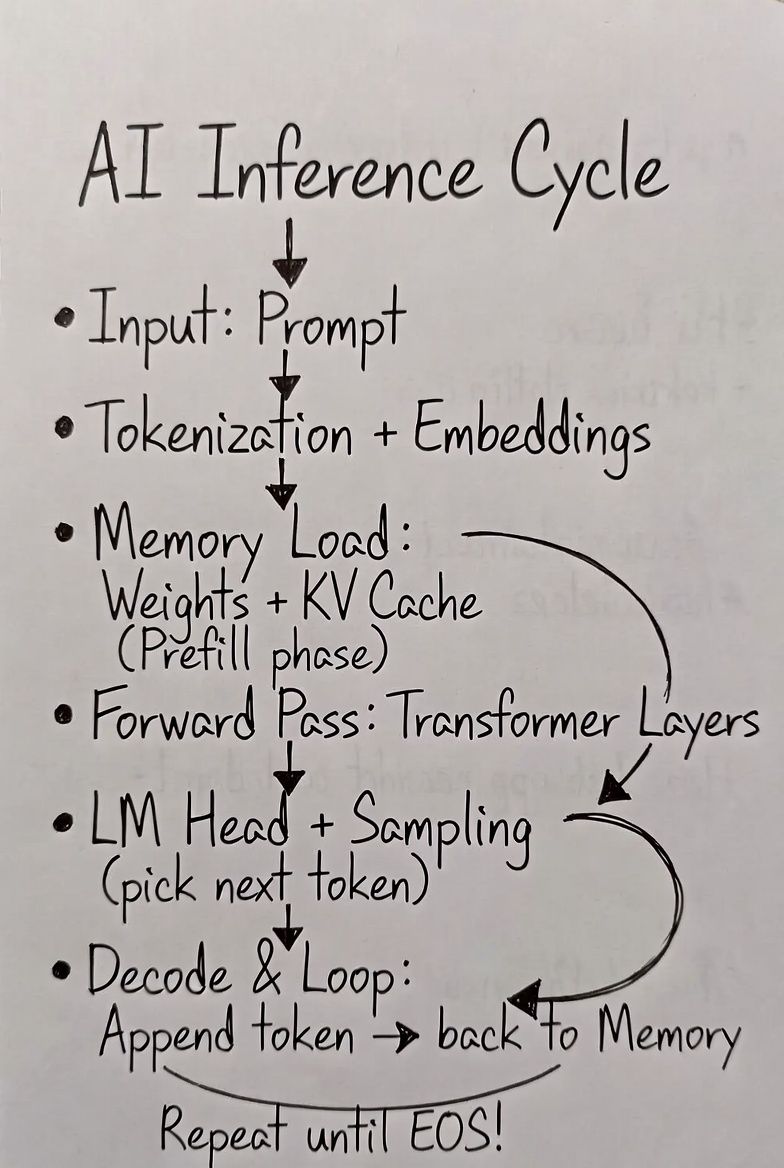
You send a prompt. A GPU somewhere processes it and sends back a response, one token at a time. That loop is inference. It is also where most of the money goes.
80–90%of a production AI system's lifetime cost is inference, not training [1]
15×GPT-4 inference cost vs training cost. $2.3B in inference by end of 2024 vs ~$150M to train
Training gets the headlines. Inference pays the bills.
An H100 rents for roughly $3/hr. When your GPU is underutilized, you get fewer tokens than the hardware can deliver. Same bill, lower output. That is over $1,000/month in cloud compute per GPU, wasted.
Most teams are bad at it. The waste is in:
Throughput. A misconfigured vLLM server runs well below its hardware ceiling. When batching, memory, and scheduling are off, GPU utilization collapses. The hardware is not the problem. The configuration is.
Latency. Real-time applications need time-to-first-token under 100ms. Most production setups don't get there without deliberate tuning.
KV cache pressure. Every token generated needs to remember everything before it. When that memory fills up, the system evicts. Throughput drops. Latency spikes. At 90% usage, you're already in trouble.
Batching. When batch size is 2 out of a possible 16, you're using 12% of the machine. The rest idles. You pay full price.
Prefill overhead. Before the first output token, the model processes your entire prompt. In workloads with 500+ token prompts, prefill alone dominates response time.
Observability. Most teams look at raw Prometheus metrics and guess. There is no standard path from "throughput is low" to "here is exactly why, here is the fix."
These are not edge cases. This is the normal state of a production inference server that has not been tuned.
Why This Matters Now
The standard story about early tech: Amazon lost money for years. Uber still does. Growth first, economics later. AI inference does not fit that story.
Amazon chose to lose money, a deliberate bet on demand. Companies running AI inference are burning money on hardware they already paid for, because it is sitting misconfigured. That is not a growth strategy. It is waste that shows up on your cloud compute bill this month.
Enterprises running production AI spend $50,000 to $500,000 per month on inference infrastructure. [2] Inference costs have dropped 280× since 2022, from $20 to $0.07 per million tokens. That gap between what hardware can do and what most teams extract from it is your cost problem today.
"The AI inferencing market will be much, much larger than the AI training market. People are running out of usable inference computing capacity." — Larry Ellison, Oracle earnings call [3]
The shortage is not GPUs. It is efficient use of the GPUs already running in production, including yours.